Sunday, July 31, 2011

How to Identify Flags and Pennants


Commodity Charts Examples

Stock Charts Examples

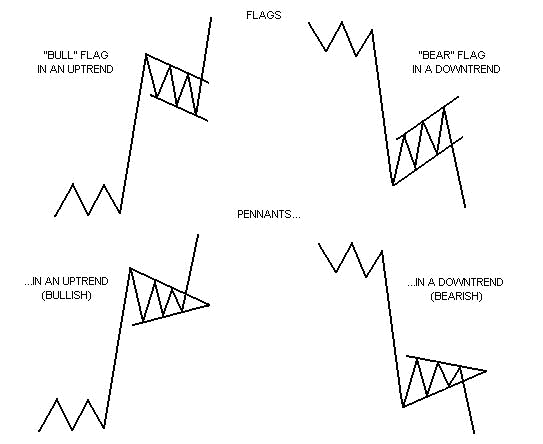
Flags and pennants can be categorized as continuation patterns. They usually represent only brief pauses in a dynamic market. They are typically seen right after a big, quick move. The market then usually takes off again in the same direction. Research has shown that these patterns are some of the most reliable continuation patterns.

Bullish flags are characterized by lower tops and lower bottoms, with the pattern slanting against the trend. But unlike wedges, their trendlines run parallel.

Bearish flags are comprised of higher tops and higher bottoms. "Bear" flags also have a tendency to slope against the trend. Their trendlines run parallel as well.

Pennants look very much like symmetrical triangles. But pennants are typically smaller in size (volatility) and duration.

(Volume generally contracts during the pause with an increase on the breakout.) (Chart examples of flag and pennant patterns using commodity charts.) (Stock charts.)


Futures and options trading carries significant risk and you can lose some, all or even more than your investment.

Stock trading involves high risks and you can lose a significant amount of money.

The information contained here was gathered from sources deemed reliable, however, no claim is made as to its accuracy or content. This does not contain specific recommendations to buy or sell at particular prices or times, nor should any of the examples presented be deemed as such. There is a risk of loss in trading futures and futures options and stocks and stocks options and you should carefully consider your financial position before making any trades. The reference to statistical probabilities does not pertain to profitability, but rather to the direction of the market. The size and the duration of the markets move, as well as entry and exit prices ultimately determines success or failure in a trade and is in no way represented in these statistics. This is not, nor is it intended to be, a complete study of chart patterns or technical analysis and should not be deemed as such.
How to Identify Rectangles


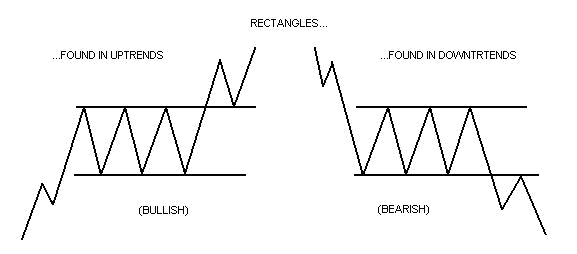
Rectangles should generally be traded as continuation patterns. They are indecision areas that are usually resolved in the direction of the trend. Research has shown that this is true far more often than not. Of course, the trendlines run parallel in a rectangle. Supply and demand seems evenly balanced at the moment. Buyers and sellers also seem equally matched. The same 'highs' are constantly tested as are the same 'lows'. The market vacillates between two clearly set parameters. (While volume doesn't seem to suffer like it does in other patterns, there usually is a lessening of activity within the pattern. But like the others, volume should noticeably increase on the breakout.) (Chart examples of rectangle patterns using commodity charts.) (Stock charts.)


Futures and options trading carries significant risk and you can lose some, all or even more than your investment.

Stock trading involves high risks and you can lose a significant amount of money.

The information contained here was gathered from sources deemed reliable, however, no claim is made as to its accuracy or content. This does not contain specific recommendations to buy or sell at particular prices or times, nor should any of the examples presented be deemed as such. There is a risk of loss in trading futures and futures options and stocks and stocks options and you should carefully consider your financial position before making any trades. The reference to statistical probabilities does not pertain to profitability, but rather to the direction of the market. The size and the duration of the markets move, as well as entry and exit prices ultimately determines success or failure in a trade and is in no way represented in these statistics. This is not, nor is it intended to be, a complete study of chart patterns or technical analysis and should not be deemed as such.
How to Identify Head and Shoulders


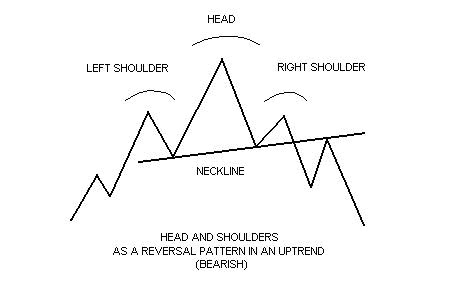
The head and shoulders pattern is generally regarded as a reversal pattern and it is most often seen in uptrends. It is also most reliable when found in an uptrend as well. Eventually, the market begins to slow down and the forces of supply and demand are generally considered in balance. Sellers come in at the highs (left shoulder) and the downside is probed (beginning neckline.) Buyers soon return to the market and ultimately push through to new highs (head.) However, the new highs are quickly turned back and the downside is tested again (continuing neckline.) Tentative buying re-emerges and the market rallies once more, but fails to take out the previous high. (This last top is considered the right shoulder.) Buying dries up and the market tests the downside yet again. Your trendline for this pattern should be drawn from the beginning neckline to the continuing neckline. (Volume has a greater importance in the head and shoulders pattern in comparison to other patterns. Volume generally follows the price higher on the left shoulder. However, the head is formed on diminished volume indicating the buyers aren't as aggressive as they once were. And on the last rallying attempt-the left shoulder-volume is even lighter than on the head, signaling that the buyers may have exhausted themselves.) New selling comes in and previous buyers get out. The pattern is complete when the market breaks the neckline. (Volume should increase on the breakout.) (Chart examples of head and shoulders patterns using commodity charts.) (Stock charts.)

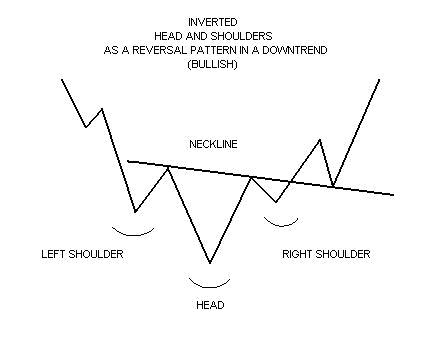
The head and shoulders pattern can sometimes be inverted. The inverted head and shoulders is typically seen in downtrends. (What's noteworthy about the inverted head and shoulders is the volume aspect. The inverted left shoulder should be accompanied by an increase in volume. The inverted head should be made on lighter volume. The rally from the head however, should show greater volume than the rally from the left shoulder. Ultimately, the inverted right shoulder should register the lightest volume of all. When the market then rallies through the neckline, a big increase in volume should be seen.) (Chart examples of inverted head and shoulders patterns using commodity charts.) (Stock charts.)


Futures and options trading carries significant risk and you can lose some, all or even more than your investment.

Stock trading involves high risks and you can lose a significant amount of money.

The information contained here was gathered from sources deemed reliable, however, no claim is made as to its accuracy or content. This does not contain specific recommendations to buy or sell at particular prices or times, nor should any of the examples presented be deemed as such. There is a risk of loss in trading futures and futures options and stocks and stocks options and you should carefully consider your financial position before making any trades. The reference to statistical probabilities does not pertain to profitability, but rather to the direction of the market. The size and the duration of the markets move, as well as entry and exit prices ultimately determines success or failure in a trade and is in no way represented in these statistics. This is not, nor is it intended to be, a complete study of chart patterns or technical analysis and should not be deemed as such.
How to Idendity Wedges


Commodity Charts Examples Stock Charts Examples

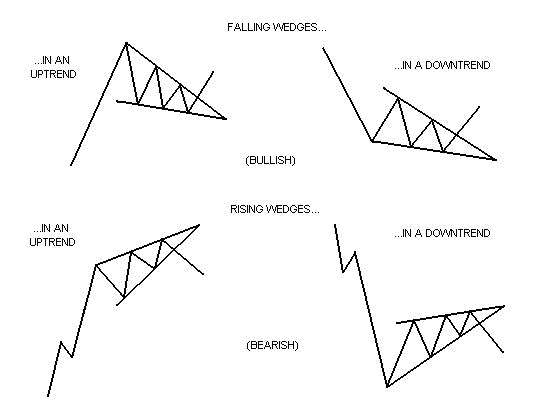
The wedge formation is also similar to a symmetrical triangle in appearance, in that they have converging trendlines that come together at an apex. However, wedges are distinguished by a noticeable slant, either to the upside or to the downside. (As with triangles, volume should diminish during its formation and increase on its resolve.)

A falling wedge is generally considered bullish and is usually found in uptrends. But they can also be found in downtrends as well. The implication however is still generally bullish. This pattern is marked by a series of lower tops and lower bottoms.

A rising wedge is generally considered bearish and is usually found in downtrends. They can be found in uptrends too, but would still generally be regarded as bearish. Rising wedges put in a series of higher tops and higher bottoms. (Chart examples of wedge patterns using commodity charts.) (Stock charts.)


Futures and options trading carries significant risk and you can lose some, all or even more than your investment.

Stock trading involves high risks and you can lose a significant amount of money.

The information contained here was gathered from sources deemed reliable, however, no claim is made as to its accuracy or content. This does not contain specific recommendations to buy or sell at particular prices or times, nor should any of the examples presented be deemed as such. There is a risk of loss in trading futures and futures options and stocks and stocks options and you should carefully consider your financial position before making any trades. The reference to statistical probabilities does not pertain to profitability, but rather to the direction of the market. The size and the duration of the markets move, as well as entry and exit prices ultimately determines success or failure in a trade and is in no way represented in these statistics. This is not, nor is it intended to be, a complete study of chart patterns or technical analysis and should not be deemed as such.
How to Identify Ascending Triangles


Commodity Charts Examples Stock Charts Examples

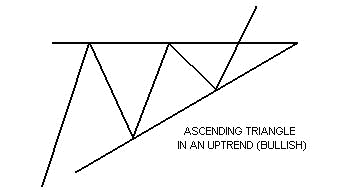
The ascending triangle is a variation of the symmetrical triangle. Ascending triangles are generally considered bullish and are most reliable when found in an uptrend. The top part of the triangle appears flat, while the bottom part of the triangle has an upward slant. In ascending triangles, the market becomes overbought and prices are turned back. Buying then re-enters the market and prices soon reach their old highs, where they are once again turned back. Buying then resurfaces, although at a higher level than before. Prices eventually break through the old highs and are propelled even higher as new buying comes in. (As in the case of the symmetrical triangle, the breakout is generally accompanied by a marked increase in volume.) (Chart examples of ascending triangle patterns using commodity charts.) (Stock charts.)


Futures and options trading carries significant risk and you can lose some, all or even more than your investment.

Stock trading involves high risks and you can lose a significant amount of money.

The information contained here was gathered from sources deemed reliable, however, no claim is made as to its accuracy or content. This does not contain specific recommendations to buy or sell at particular prices or times, nor should any of the examples presented be deemed as such. There is a risk of loss in trading futures and futures options and stocks and stocks options and you should carefully consider your financial position before making any trades. The reference to statistical probabilities does not pertain to profitability, but rather to the direction of the market. The size and the duration of the markets move, as well as entry and exit prices ultimately determines success or failure in a trade and is in no way represented in these statistics. This is not, nor is it intended to be, a complete study of chart patterns or technical analysis and should not be deemed as such.
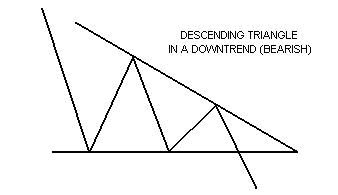
How to Identify Descending Triangles


The descending triangle, also a variation of the symmetrical triangle, is generally considered to be bearish and is usually found in downtrends. Unlike the ascending triangle, this time the bottom part of the triangle appears flat. The top part of the triangle has a downward slant. Prices drop to a point where they are oversold. Tentative buying comes in at the lows, and prices perk up. The higher price however attracts more sellers and prices re-test the old lows. Buyers then once again tentatively re-enter the market. The better prices though, once again attract even more selling. Sellers are now in control and push through the old lows of this pattern, while the previous buyers rush to dump their positions. (And like the symmetrical triangle and the ascending triangle, volume tends to diminish during the formation of the pattern with an increase in volume on its resolve.) (Chart examples of descending triangle patterns using commodity charts.) (Stock charts.)


Futures and options trading carries significant risk and you can lose some, all or even more than your investment.

Stock trading involves high risks and you can lose a significant amount of money.

The information contained here was gathered from sources deemed reliable, however, no claim is made as to its accuracy or content. This does not contain specific recommendations to buy or sell at particular prices or times, nor should any of the examples presented be deemed as such. There is a risk of loss in trading futures and futures options and stocks and stocks options and you should carefully consider your financial position before making any trades. The reference to statistical probabilities does not pertain to profitability, but rather to the direction of the market. The size and the duration of the markets move, as well as entry and exit prices ultimately determines success or failure in a trade and is in no way represented in these statistics. This is not, nor is it intended to be, a complete study of chart patterns or technical analysis and should not be deemed as such.
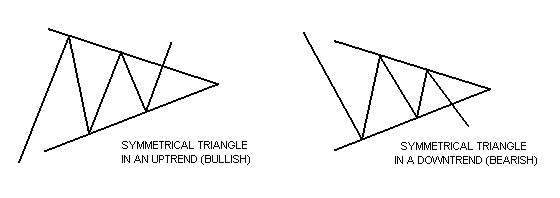
How to Identify Symmetrical Triangles


Commodity Charts Examples

Stock Charts Examples

Symmetrical triangles can be characterized as areas of indecision. A market pauses and future direction is questioned. Typically, the forces of supply and demand at that moment are considered nearly equal. Attempts to push higher are quickly met by selling, while dips are seen as bargains. Each new lower top and higher bottom becomes more shallow than the last, taking on the shape of a sideways triangle. (It's interesting to note that there is a tendency for volume to diminish during this period.) Eventually, this indecision is met with resolve and usually explodes out of this formation (often on heavy volume.) Research has shown that symmetrical triangles overwhelmingly resolve themselves in the direction of the trend. With this in mind, symmetrical triangles in my opinion, are great patterns to use and should be traded as continuation patterns. (Chart examples of symmetrical triangle patterns using commodity charts.) (Stock charts.)


Futures and options trading carries significant risk and you can lose some, all or even more than your investment.

Stock trading involves high risks and you can lose a significant amount of money.

The information contained here was gathered from sources deemed reliable, however, no claim is made as to its accuracy or content. This does not contain specific recommendations to buy or sell at particular prices or times, nor should any of the examples presented be deemed as such. There is a risk of loss in trading futures and futures options and stocks and stocks options and you should carefully consider your financial position before making any trades. The reference to statistical probabilities does not pertain to profitability, but rather to the direction of the market. The size and the duration of the markets move, as well as entry and exit prices ultimately determines success or failure in a trade and is in no way represented in these statistics. This is not, nor is it intended to be, a complete study of chart patterns or technical analysis and should not be deemed as such.
How to Identify Trends and Trendlines

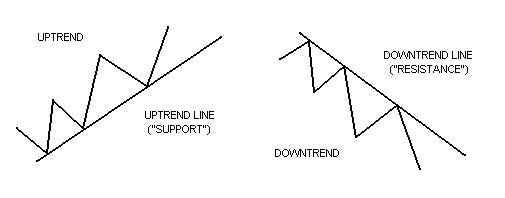
A trend can be defined as the direction in which the market is moving in. When the supply of a commodity or stock is greater than the demand, the trend will be down as there are more sellers than buyers. When the demand is greater than the supply, the trend will be up as there are more buyers than sellers. If the forces of supply and demand are nearly equal, the market will move sideways. Eventually, when new information enters the market, it will begin to trend again, either up, down or perhaps sideways still, depending on how that information is viewed; positive (bullish), negative (bearish) or neutral (sideways.) It's important to remember that money can be made or lost in bullish (uptrending), bearish (downtrending) and neutral (sideways - trending) markets. Trendlines help in determining what trend is in place.

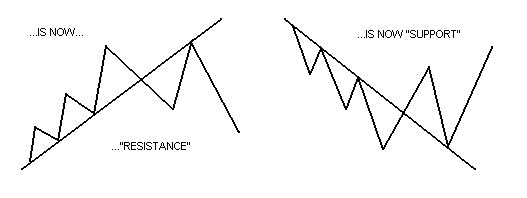
If a market is moving up, a line can be drawn connecting each successive higher bottom. This is an uptrend line or 'support'. As long as the market remains on or above this line, the uptrend is intact. If a market is moving down, a line can be drawn connecting each successive lower top. This is a downtrend line or 'resistance'. As long as prices remain on or below this line, the downtrend is intact.

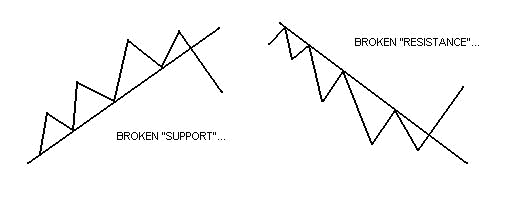
In general, once a trendline is broken, the trend which was previously in force is considered over, or at least in pause. It should be noted that when an uptrend line or 'support' is broken, it then acts as 'resistance'. Likewise, if a downtrend line or 'resistance' is broken, it then becomes 'support'.

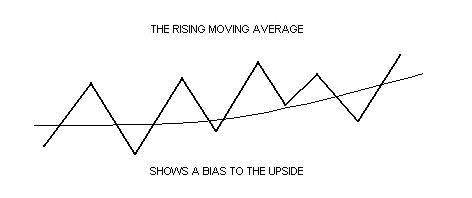
Moving averages are also very helpful in defining a trend. Sometimes, when no clear trendline can be drawn, moving averages can clarify market bias by showing which direction the market has favored over a specific period of time. A rising moving average is generally price friendly (bullish), while a declining moving average would be considered negative (bearish.) A flat moving average would be viewed as neutral or (sideways-trending.)


Futures and options trading carries significant risk and you can lose some, all or even more than your investment.

Stock trading involves high risks and you can lose a significant amount of money.

The information contained here was gathered from sources deemed reliable, however, no claim is made as to its accuracy or content. This does not contain specific recommendations to buy or sell at particular prices or times, nor should any of the examples presented be deemed as such. There is a risk of loss in trading futures and futures options and stocks and stocks options and you should carefully consider your financial position before making any trades. The reference to statistical probabilities does not pertain to profitability, but rather to the direction of the market. The size and the duration of the markets move, as well as entry and exit prices ultimately determines success or failure in a trade and is in no way represented in these statistics. This is not, nor is it intended to be, a complete study of chart patterns or technical analysis and should not be deemed as such.
How to make Money in Bear Market | Investment strategies in bear market:


I received the following article today in my mail. It’s a nicely written piece, so I thought let me share it with all of you.

Everyone loves bull markets. In a bull market, every stock will give us good returns. But bear markets test one's real ability, company's fundamentals and investor's patience levels. But Bear markets also provide wonderful investment opportunities if we can able to spot investment chances early. We can make good money in very short term period.

2 types of investment strategies in bear market:

1. Accumulate more on every fall and invest for long term to reap full benefits. Even good stocks will be available at cheap prices in bear market due to bad sentiment.

2. Ultra short term opportunities. You should always be on alert to utilise these chances. If you enter late, losses will be more as it happened in case of Orchid chemicals investors who entered into that stock at above 300 levels.

Alert: Operators will try to fool investors by artificially rising stock prices by spreading rumours. Be careful with stocks like Ispat, RNRL, IFCI and Essar Oil. If don't have enough knowledge on Stock Markets, stay away from these things. If you are a long term investor, don't buy major stocks at current levels.

Bear markets- best money making opportunities:

1. Over reaction: When L&T announced minor losses in Forex derivatives, everyone sold it despite strong fundamentals of the comapny. We should see for such opportunities to enter into those stocks.

2. Sudden options: Orchid chemicals suddenly lost 50% value despite no change in fundamentals. That was due to Bear sterns sell off. We should be always on alert for such chances.

3. Over enthusiasm: Markets over reacted to open offer and acquisition rumours and took stock price to unreasonable 350 levels. Even if Ranbaxy take over Orchids, 250-280 is reasonable price. We will look for short selling opportunities in such instances.

4. Buyback offers: In a bear markets, prices generally do not justify its intrinsic value. So companies try to buy back shares at higher prices. Just see what happened in Sasken Communications. Look for good buy back offers.

5. Never chase operators: If a stock is rising without any reason, simply stay away from such stocks. It is due to operators activities. Never invest in any stock basing on rumours.

6. Crucial breaks: Some decisions will change company fundamentals to much attractive levels. In these instances, stock price will rise for prolonged period as it happened in Bombay Dyeing.

7. Rallies in bear market generally will not last for prolonged periods. So, make money in short term and exit that stock.

8. Short term opportunities will be available in stocks that lost more than 50% in a short period despite good growth. We should identify them early before markets recognise them as it happened in ICSA India and Gujarat NRE Coke.

Investors can't sit idle in bear markets as investors over react to bad news and stocks will lose all the gains in 1-2 days. These ultra short term opportunities are only for experienced investors who can spend enough time on stock market research and at trading terminal. More companies are planning to buy back shares means we are going to get investment chances to make quick money.

DISCLAIMER

sharesonlinechars shall not be held responsible for the actions of individuals, parties, or corporations taken in response to the ideas, thoughts, concepts or information presented in this blog. Hence all the visitors are requested to apply their prudence and consult their financial advisor before acting on any of the recommendations by this blog